Management Plugin
Overview
The RabbitMQ management plugin provides an HTTP-based API for management and monitoring of RabbitMQ nodes and clusters, along with a browser-based UI and a command line tool, rabbitmqadmin.
It periodically collects and aggregates data about many aspects of the system. Those metrics are exposed to human operators in the UI. The API it provides can be used by monitoring systems, however, Prometheus is the recommended option for long term storage, alerting, visualisation, chart analysis and so on.
The plugin also provides tools for analysing memory usage of the node, and other features related to monitoring, metrics, user, permission, and topology management. Previously it also provided definition export and import functionality. Those are now core RabbitMQ features and do not require or rely on this plugin.
This guide covers:
- Basic usage of management UI
- The HTTP API provided by the management plugin
- General plugin configuration
- Reverse proxy (Nginx or Apache) in front of the HTTP API
- How to enable HTTPS for management UI and its underlying API
- How this plugin operates in multi-node clusters
- How to disable metric collection to use Prometheus exclusively for monitoring
- How to create a user with limited permissions for monitoring purposes only
- Authenticating with OAuth 2
- Strict transport security, Content security policy, cross-origin resource sharing, and other security-related header control
- Statistics collection interval
- Message rate mode (rate fidelity) and data retention intervals
- HTTP API request logging
- How to set a management UI login session timeout
- How to reset statistics database used by this plugin
The plugin also provides extension points that other plugins, such as rabbitmq-top or rabbitmq-shovel-management, use to extend the UI.
Management UI and External Monitoring Systems
Prefer external monitoring options where possible. Infrastructure and kernel-level monitoring is also crucially important to have in any production system.
The management UI and its HTTP API is a built-in monitoring option for RabbitMQ. This is a convenient option for development and in environments where external monitoring is difficult or impossible to introduce.
However, the management UI has a number of limitations:
- The monitoring system is intertwined with the system being monitored
- A certain amount of overhead
- It only stores recent data (think hours, not days or months)
- It has a basic user interface
- Its design emphasizes ease of use over best possible availability.
- Management UI access is controlled via the RabbitMQ permission tags system (or a convention on JWT token scopes)
Long term metric storage and visualisation services such as Prometheus and Grafana or the ELK stack are more suitable options for production systems. They offer:
- Decoupling of the monitoring system from the system being monitored
- Lower overhead
- Long term metric storage
- Access to additional related metrics such as those of the Erlang runtime ones
- More powerful and customizable user interface
- Ease of metric data sharing: both metric state and dashboards
- Metric access permissions are not specific to RabbitMQ
- Collection and aggregation of node-specific metrics which is more resilient to individual node failures
RabbitMQ provides first class support for Prometheus and Grafana as of 3.8. It is recommended for production environments.
Getting Started
The management plugin is included in the RabbitMQ distribution. Like any other plugin, it must be enabled before it can be used. That's done using rabbitmq-plugins:
rabbitmq-plugins enable rabbitmq_management
Node restart is not required after plugin activation.
During automated deployments, the plugin can be enabled via enabled plugin file.
Usage
Management UI Access
The management UI can be accessed using a Web browser at http://node-hostname:15672/.
For example, for a node running on a machine with the hostname of warp10.local,
it can be accessed by users with sufficient privileges at either http://warp10.local:15672/
or http://localhost:15672/ (provided that localhost resolves correctly).
Note that the UI and HTTP API port — typically 15672 — does not support AMQP 0-9-1, AMQP 1.0, STOMP or MQTT connections. Separate ports should be used by those clients.
Users must be granted permissions for management UI access.
Notable Features
The management UI is implemented as a single page application which relies on the HTTP API. Some of the features include:
Declare, list and delete exchanges, queues, bindings, users, virtual hosts and user permissions.
Monitor queue length, message rates (globally and per queue, exchange or channel), resource usage of queue, node GC activity, data rates of client connections, and more.
Monitor node resource use: sockets and file descriptors, memory usage breakdown, available disk space and bandwidth usage on inter-node communication links.
Manage users (provided administrative permissions of the current user).
Manage policies and runtime parameters (provided sufficient permissions of the current user).
Export schema (vhosts, users, permissions, queues, exchanges, bindings, parameters, policies) and import it on node start. This can be used for recovery purposes or setup automation of new nodes and clusters.
Force close client connections, purge queues.
Send and receive messages (useful in development environments and for troubleshooting).
The UI application supports recent versions of Google Chrome, Safari, Firefox, and Microsoft Edge browsers.
Management UI Access in Clusters
Any cluster node with rabbitmq_management plugin enabled can be
used for management UI access or data collection by monitoring tools.
It will reach out to other nodes and collect their stats, then aggregate and return a response
to the client.
To access management UI the user has to authenticate and have certain permissions (be authorised). This is covered in the following section.
Access and Permissions
The management UI requires authentication and authorisation, much like RabbitMQ requires it from connecting clients. In addition to successful authentication, management UI access is controlled by user tags. The tags are managed using rabbitmqctl. Newly created users do not have any tags set on them by default.
See Deployment Guidelines for general recommendations on user and credential management.
| Tag | Capabilities |
|---|---|
| (None) | No access to the management plugin |
| management | Anything the user could do via messaging protocols plus:
|
| policymaker | Everything "management" can plus:
|
| monitoring | Everything "management" can plus:
|
| administrator | Everything "policymaker" and "monitoring" can plus:
|
Note that since "administrator" does everything "monitoring" does, and "monitoring" does everything "management" does, each user often needs a maximum of one tag.
Normal RabbitMQ permissions to resources still apply to monitors and administrators; just because a user is a monitor or administrator does not grant them full access to exchanges, queues and bindings through the management plugin or other means.
All users can only list objects within the virtual hosts they have any permissions for.
Monitoring-Only (Read-Only) Access
Some users are created exclusively for observability purposes. More specifically, such users need to list all objects and inspect their metrics but not have the permissions to add or delete entities (queues, streams, exchanges, bindings, and so on). Such users also do not need to publish or consume messages.
This can be accomplished by
- Creating a user tagged as
monitoring - Granting it permissions (
configure,read,write) that are empty (will match no objects)
Both steps can be accomplished using the management UI or the HTTP API, or, if those options are not available or optimal, using CLI tools:
rabbitmqctl add_usercan be used to create the userrabbitmqctl set_permissionsto grant the user the desired permissions and finally,rabbitmqctl set_user_tagsto tag it withmonitoring, which will grant them management UI access
Command Line Examples: Create a User with Monitoring-Only Access
The following example creates a user with complete access to the management UI/HTTP API (as in, all virtual hosts and management features):
- bash
- PowerShell
- cmd
# See the Access Control guide to learn about user management.
#
# Password is provided as a command line argument.
# Note that certain characters such as !, &, $, #, and so on must be escaped to avoid
# special interpretation by the shell.
rabbitmqctl add_user 'monitoring' '2a55f70a841f18b97c3a7db939b7adc9e34a0f1b'

# tag user 'monitoring' with a tag of the same name
rabbitmqctl set_user_tags 'monitoring' 'monitoring'

# grant the user empty permissions
rabbitmqctl set_permissions --vhost 'vhost-name' 'monitoring' '^$' '^$' '^$'
# See the Access Control guide to learn about user management.
#
# password is provided as a command line argument
rabbitmqctl.bat add_user 'monitoring' '9a55f70a841f18b97c3a7db939b7adc9e34a0f1d'

# passwords with special characters must be quoted correctly
rabbitmqctl.bat add_user 'monitoring' '"w63pnZ&LnYMO(t"'

# grant the user empty permissions
rabbitmqctl.bat set_permissions --vhost 'vhost-name' 'monitoring' '^$' '^$' '^$'
rem See the Access Control guide to learn about user management.

rem password is provided as a command line argument
rabbitmqctl.bat add_user "monitoring" "9a55f70a841f18b97c3a7db939b7adc9e34a0f1d"

rem passwords with special characters must be quoted correctly
rabbitmqctl.bat add_user "monitoring" "w63pnZ&LnYMO(t"

rem grant the user empty permissions
rabbitmqctl set_permissions --vhost "vhost-name" "monitoring" "^$" "^$" "^$"
Authenticating with OAuth 2
You can configure RabbitMQ to use JWT-encoded OAuth 2.0 access tokens to authenticate client applications, however, to use OAuth 2.0 authentication in the management UI, you have to configure it separately.
There are two ways to initiate OAuth 2.0 authentication in the management UI:
-
Service-Provided Initiated login. The is the OAuth method and the default way to initiate authentication in the management UI. It uses the OAuth 2.0 Authorization Code Flow with PKCE to redirect users to the configured OAuth 2.0 provider to authenticate. When they are authenticated, users get an access token, and are then returned back to the management UI where they are automatically logged in. The management UI is tested against these OAuth 2.0 providers:
-
Identity-Provider Initiated login. For this type of login, users must come to RabbitMQ with an access token.This type of authentication is typical in portals which offers access to various applications/services to authenticated users. One of those services could be one or many RabbitMQ clusters. When a user requests access to a RabbitMQ cluster, the portal forwards the user to RabbitMQ's management UI with an access token issued for the user and RabbitMQ cluster. This type of authentication is covered in the sub-section Identity-Provider initiated logon.
To configure OAuth 2.0 in the management UI you need a minimum configuration. However, you may require additional configuration depending on your use case:
- Client secret
- Allow Basic and OAuth 2 authentication for management HTTP API
- Allow Basic and OAuth 2 authentication for management UI
- Logging out of the management UI
- Configure extra parameters for authorization and token endpoints
- Special attention to CSP header
connect-src - Identity-Provider initiated logon
- Logout from Identity-Provider initiated logon
- Support multiple OAuth 2.0 resources
- Preselect or predetermine authentication mechanism
- Troubleshooting
Minimum configuration
The first section is the minimum configuration required to use OAuth 2.0 authentication in the management UI. The following sections explain how to further configure OAuth 2.0 depending of the use cases.
Given the following configuration of the OAuth 2.0 plugin:
auth_oauth2.resource_server_id = new_resource_server_id
auth_oauth2.issuer = https://my-oauth2-provider.com/realm/rabbitmq
To use OAuth 2.0 authentication, apply the following configuration in the management UI:
management.oauth_enabled = true
management.oauth_client_id = rabbit_user_client
management.oauth_scopes = <SPACE-SEPARATED LIST OF SCOPES. See below>
-
oauth_enabledis a mandatory field -
oauth_client_idis a mandatory field. It is the OAuth Client Id associated with this RabbitMQ cluster in the OAuth Provider, and it is used to request a token on behalf of the user. -
oauth_scopesis a mandatory field which must be set at all times except in the case when OAuth providers automatically grant scopes associated to theoauth_client_id.oauth_scopesis a list of space-separated strings that indicate which permissions the application is requesting. Most OAuth providers only issue tokens with the scopes requested during the user authentication. RabbitMQ sends this field along with itsoauth_client_idduring the user authentication. If this field is not set, RabbitMQ defaults toopenid profile.
Given above configuration, when a user visits the management UI, the following two events take place:
-
RabbitMQ uses the URL found in
auth_oauth2.issuerto download the OpenID Provider configuration. Learn more in the OAuth 2.0 guidewarningIf RabbitMQ cannot download the OpenID provider configuration, it shows an error message and the OAuth 2.0 authentication option will be disabled in the management UI
warningmanagement.oauth_metadata_urlandmanagement.oauth_resource_servers.$id.oauth_metadata_urlare deprecated. You should configure the OpenId Discovery endpoint's path as it is explained here. These two settings will no longer exist in RabbitMQ 4.2.0. In the meantime, RabbitMQ will support them until you update your configuration.tipIf you used to configure
auth_oauth2.metadata_urlbecause your provider used a slightly different OpenId Discovery endpoint url, since RabbitMQ 4.1 you should instead configure the correct path and/or include any additional parameters. Please read this section of the documentation where it is explained how to do it.auth_oauth2.metadata_urlmay be deprecated in future versions. -
RabbitMQ displays a button with the label "Click here to login". When the user clicks on the button, the management UI initiates the OAuth 2.0 Authorization Code Flow, which redirects the user to the identity provider to authenticate and get a token.
Configure client secret
Important: From the OAuth 2.0 point of view, the management UI is a public app which means it cannot securely store credentials such as the client_secret. This means that RabbitMQ should not need to present a client_secret when authenticating users.
However, there could be OAuth Providers which requires a client_secret either for the initial user authentication request or for the token refresh request. For instance, UAA server requires client_secret to refresh the token. For these cases, it is possible to configure oauth_client_secret like shown below:
management.oauth_enabled = true
management.oauth_client_id = rabbit_user_client
management.oauth_client_secret = rabbit_user_client
management.oauth_scopes = openid profile rabbitmq.*
Allow Basic and OAuth 2 authentication for Management HTTP API
When using management.oauth_enabled = true, it is still possible to authenticate
with HTTP basic authentication
against the HTTP API. This means both of the following examples will work:
# swap <token> for an actual token
curl -i -u ignored:<token> http://localhost:15672/api/vhosts
as well as
curl -i --header "authorization: Basic <encoded credentials>" http://localhost:15672/api/vhosts
To switch to authenticate using OAuth 2 exclusively for management HTTP access, set the
management.disable_basic_auth configuration key to true:
...
management.disable_basic_auth = true
...
When setting management.disable_basic_auth to true, only the Bearer (token-based) authorization method will
work, for example:
# swap <token> for an actual token
curl -i --header "authorization: Bearer <token>" http://localhost:15672/api/vhosts
This is true for all endpoints except GET /definitions and POST /definitions. Those
endpoints require the token to be passed in the token query string parameter.
Allow Basic and OAuth 2 authentication for management UI
When using management.oauth_enabled = true, it is still possible to authenticate
with HTTP basic authentication
in the management UI.
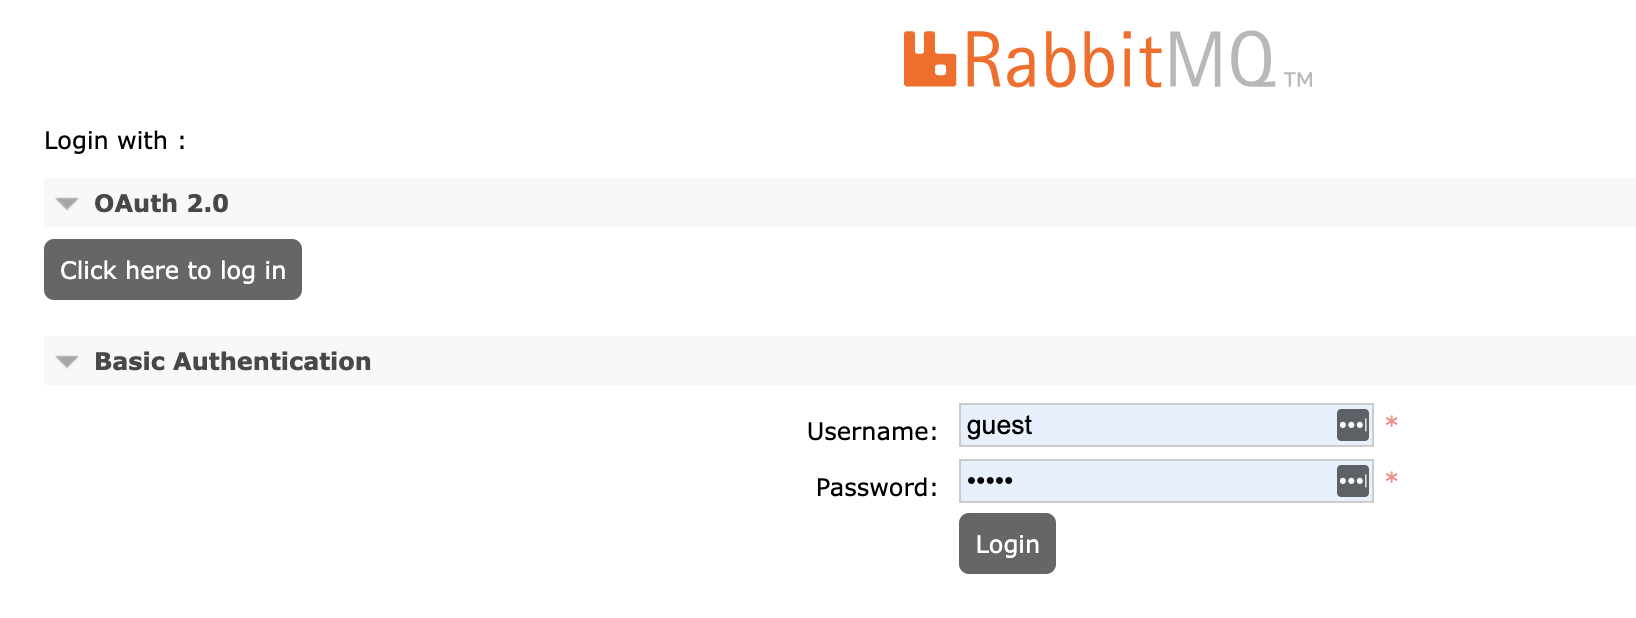
By default, management.oauth_disable_basic_auth has the value true, meaning that when OAuth 2 is
enabled, the management UI only accepts OAuth 2 authentication. The management UI shows a button with the label Click here to login like shown in the screenshot below:

To support OAuth 2.0 and Basic Authentication, set the
management.oauth_disable_basic_auth configuration key to false:
...
management.oauth_disable_basic_auth = false
...
The management UI shows now a username/password login form for Basic Authentication in addition to the Click here to login button for OAuth 2 authentication:
Logging out of the management UI
RabbitMQ implements the OpenID Connect RP-Initiated Logout 1.0 specification to logout users from the management UI and from the OAuth Provider. It works as follows:
- The user clicks Logout.
- If the OpenId Connect Discovery endpoint returns an
end_session_endpoint, the management UI sends a logout request to that endpoint to close the user's session in the OAuth Provider. When the request completes, the user is also logged out from the management ui. - If there is no
end_session_endpointreturned, then the user is only logged out from the management UI.
If the OpenId Connect Discovery endpoint does not return an end_session_endpoint, you can configure it in the OAuth 2.0 authentication backend plugin.
RabbitMQ 3.13.1 and earlier versions require the OpenId Connect Discovery endpoint end_session_endpoint returned for OAuth 2.0 authentication to work.
There are other two additional scenarios which can trigger a logout. One scenario occurs when the OAuth Token expires. Although RabbitMQ renews the token in the background before it expires, if the token expires, the user is logged out. The second scenario is when the management UI session exceeds the maximum allowed time configured on the Login Session Timeout.
Configure extra parameters for authorization and token endpoints
There are some OAuth 2.0 providers which require extra parameters in the request sent to the authorization endpoint and/or to the token endpoint. These parameters are custom parameters. The Management UI already sends all the parameters required by the OAuth 2.0 Authorization Code flow.
Here is an example of setting an extra parameter called audience for both endpoints, the authorization and token endpoint:
management.oauth_authorization_endpoint_params.audience = some-audience-id
management.oauth_token_endpoint_params.audience = some-audience-id
You can configure as many parameters as you need.
Special attention to CSP header connect-src
To support the OAuth 2.0 protocol, RabbitMQ makes asynchronous REST calls to the OpenId Connect Discovery endpoint. If you override the default CSP headers, you have to make sure that the connect-src CSP directive whitelists the OpenId Connect Discovery endpoint.
For instance, if you configured the CSP header with the value default-src 'self', you are, by default, setting connect-src 'self' which means you are denying RabbitMQ access to any external endpoint; hence disabling OAuth 2.0.
In addition to the connect-src CSP header, RabbitMQ also needs the CSP directives unsafe-eval unsafe-inline, otherwise the OAuth 2.0 functionality may not work.
Identity-Provider initiated logon
By default, the management UI uses the OAuth 2.0 authorization code flow to authenticate and authorize users. However, there are scenarios where users prefer to be automatically redirected to RabbitMQ without getting involved in additional logon flows. By using OAuth 2.0 proxies and web portals, these additional logon flows can be avoided. With a single click, users navigate straight to the management UI with a token obtained under the covers. This is known as Identity-Provider initiated logon.
RabbitMQ exposes a setting called management.oauth_initiated_logon_type whose default value sp_initiated.
To use an Identity-Provider initiated logon you set it to idp_initiated.
management.oauth_enabled = true
management.oauth_initiated_logon_type = idp_initiated
management.oauth_provider_url = https://my-web-portal
With the previous settings, the management UI exposes the HTTP endpoint /login which accepts content-type: application/x-www-form-urlencoded and it expects the JWT token in the access_token form field. This is the endpoint where the Web portal will redirect users to the management UI.
Additionally, RabbitMQ also accepts a JWT token in the HTTP Authorization header when the user lands on the management UI.
With sp_initiated logon types, there is no need to configure the oauth_provider_url if auth_oauth2.issuer was set. However, for idp_initiated flows the auth_oauth2.issuer url may not necessarily be the url where to send users to authenticate. When this occurs, the management.oauth_provider_url overrides the auth_oauth2.issuer url.
Logout from Identity-Provider logon
If end_session_endpoint is configured, on logout the user is redirected to that endpoint. Otherwise, the user is redirected to management.oauth_provider_url.
Use end_session_endpoint when the identity provider must close the user's session and perform cleanup before redirecting to the identity provider's root URL.
The following example uses a keycloak identity provider. The end_session_endpoint points to a proxy's sign_out endpoint:
auth_oauth2.issuer = https://keycloak:8443/realms/test
auth_oauth2.end_session_endpoint = https://localhost:8442/oauth2/sign_out?rd=https://keycloak:8443/realms/test/protocol/openid-connect/logout
Support multiple OAuth 2.0 resources
Prerequisite
To configure multiple OAuth 2.0 resources in the management UI, you first configure them in the OAuth 2.0 plugin. Let's say you have the following OAuth 2.0 plugin configuration which consists of four OAuth 2.0 resources:
auth_oauth2.issuer = http://some_idp_url
auth_oauth2.scope_prefix = rabbitmq.
auth_oauth2.resource_servers.1.id = rabbit_prod
auth_oauth2.resource_servers.2.id = rabbit_dev
auth_oauth2.resource_servers.3.id = rabbit_qa
auth_oauth2.resource_servers.4.id = rabbit_internal
The next sections configure these resources in the management UI.
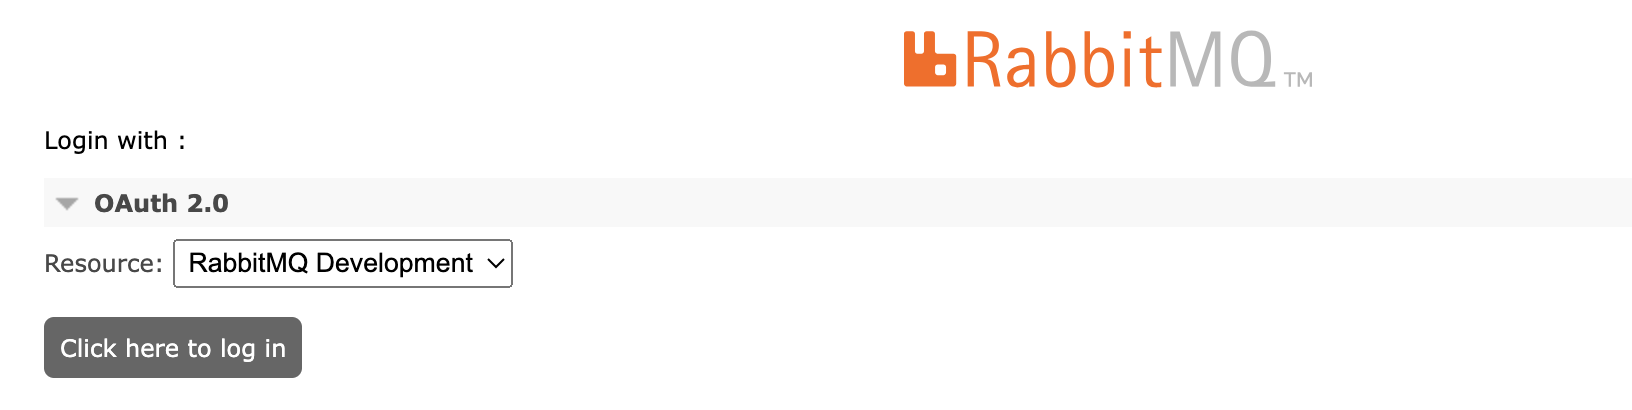
How OAuth 2.0 resources are presented to users
When there is more than one OAuth 2.0 resource configured in the management UI, RabbitMQ shows a drop-down menu in addition to the button with the label Click here to logon. The drop-down menu has one option per resource. The label of the option is the resource's ID by default, but you can override it.
Resources are listed in the order in which they were configured.
You can have some resources configured with sp_initiated log-on and others with idp_initiated
log-on. You can disable a resource so that the resource does not appear as an option in the
drop-down menu.
Optionally set common settings for all resources
If the majority of resources have in common some configuration values, you set them like shown below:
management.oauth_enabled = true
management.oauth_initiated_logon_type = sp_initiated
management.oauth_scopes = openid rabbitmq.tag:management rabbitmq.read:*/*
Here we have configured that all resources, or the majority of them, requires sp_initiated logon type and the scopes claimed to the Authorization Server are openid rabbitmq.tag:management rabbitmq.read:*/*.
sp_initiated is the default value for management.oauth_initiated_logon_type, therefore you would not need to configure it.
Override default oauth_initiated_logon_type for each resource
Let's say that the resource rabbit_qa requires idp_initiated logon however the logon type configured for all resources is sp_initiated. The configuration below overrides the logon type and also the URL of the OAuth Provider.
management.oauth_resource_servers.3.id = rabbit_qa
management.oauth_resource_servers.3.label = RabbitMQ QA
management.oauth_resource_servers.3.oauth_initiated_logon_type = idp_initiated
management.oauth_resource_servers.3.oauth_provider_url = http://qa_url
Set oauth_client_id setting, if required, and the label for each resource
Next, configure the oauth_client_id for each resource which uses sp_initiated logon type.
This is the minimum setting required for sp_initiated logon type. The following example that exposes the resource rabbit_prod with its oauth_client_id and its label. If you do not specify the label, the management UI uses the id instead.
management.oauth_resource_servers.1.id = rabbit_prod
management.oauth_resource_servers.1.oauth_client_id = rabbit_prod_mgt_ui
management.oauth_resource_servers.1.label = RabbitMQ Production
With this configuration, when the user chooses to option RabbitMQ Production, RabbitMQ initiates the Authorization Code flow which takes the user to the URL configured in auth_oauth2.issuer with
the following settings:
client_id:rabbit_prod_mgt_uiresource:rabbit_prodscopes:openid rabbitmq.tag:management rabbitmq.read:*/*
Configure extra parameters for authorization and token endpoints
There are some OAuth 2.0 providers which require extra parameters in the request sent to the authorization endpoint and/or to the token endpoint. These parameters are custom parameters and specified per resource. The Management UI already sends all the parameters required by the OAuth 2.0 Authorization Code flow.
Here is an example of setting an extra parameter called audience for both endpoints for the resource some-resource-id:
management.oauth_resource_servers.2.id = some-resource-id
management.oauth_resource_servers.2.oauth_authorization_endpoint_params.audience = some-resource-id
management.oauth_resource_servers.2.oauth_token_endpoint_params.audience = some-resource-id
Optionally do not expose some resources in the management UI
You may not want to expose all configured resources in the OAuth 2.0 plugin. For instance, in the following example, you are not exposing the resource rabbit_internal which is left for applications to authenticate via one of the messaging protocols.
management.oauth_resource_servers.4.id = rabbit_internal
management.oauth_resource_servers.4.disabled = true
Management UI screenshot without Basic Authentication
This is the management UI layout for the previous configuration with basic authentication deactivated in the management UI (management.oauth_disable_basic_auth = true).
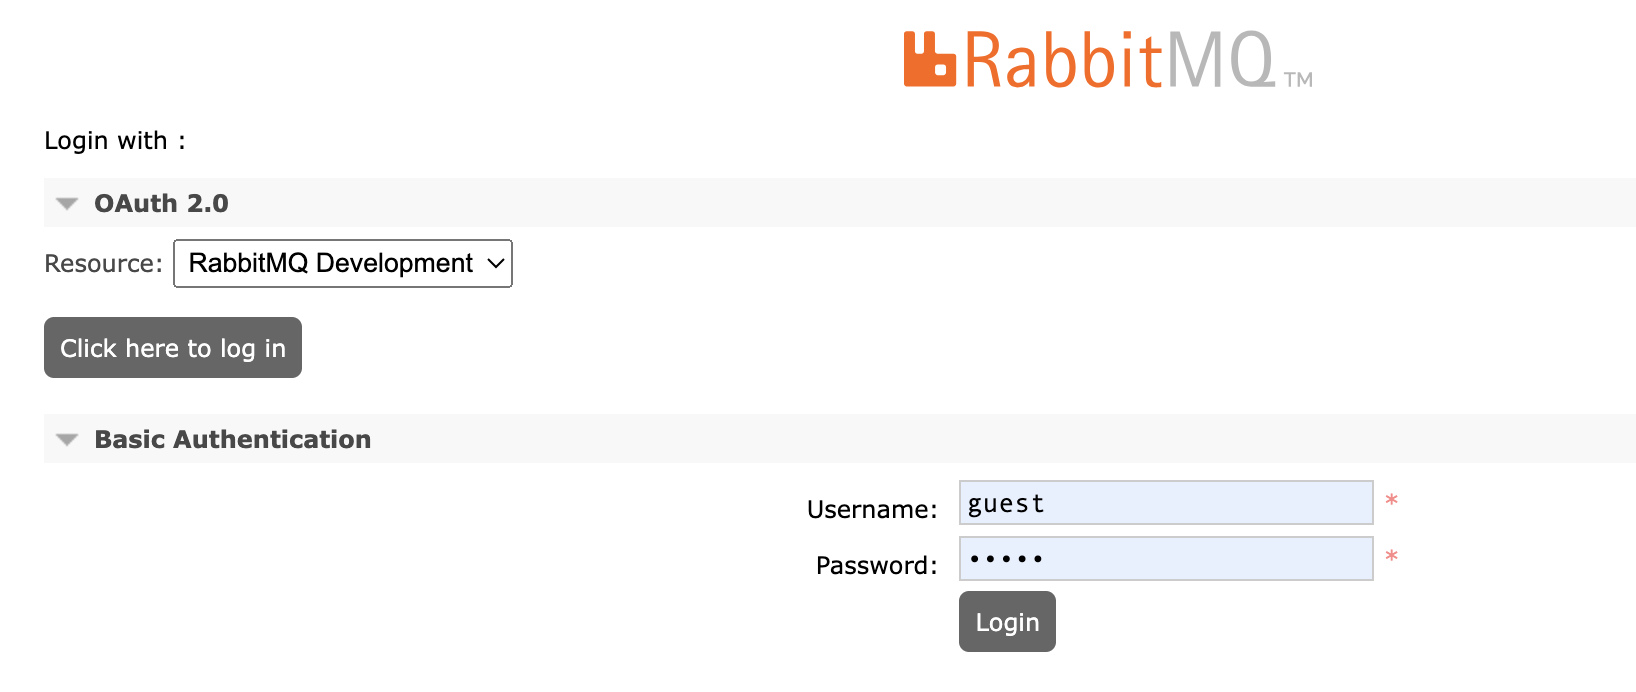
Management UI screenshot with Basic Authentication
And this is the management UI with Basic Authentication activated (management.oauth_disable_basic_auth = false).
Preselect or predetermine authentication mechanism
By default, when users navigate to the management UI home page they see all available authentication mechanisms and can choose which one to use. However, in some scenarios, users might be routed to the management UI with an authentication mechanism already preselected or predefined. This allows external systems to guide users to a specific authentication flow.
To preselect or predetermine the authentication mechanism, users must be sent to the /login endpoint
with the appropriate request parameters. The management UI then redirects them back to the home page
configured according to their preferred authentication mechanism.
The following request parameters control the behaviour:
Preselection Mode (preferred_auth_mechanism)
Use the preferred_auth_mechanism request parameter to preselect an authentication method while
still showing all options.
-
OAuth 2.0 resource:
/login?preferred_auth_mechanism=oauth2:rabbit_dev- Expands the OAuth 2.0 section and collapses the basic authentication section in the home page
- Preselects the OAuth 2.0 resource server, such as
rabbit_dev
-
Basic authentication:
/login?preferred_auth_mechanism=basic- Expands the basic authentication section and collapses the OAuth 2.0 section
Strict Mode (strict_auth_mechanism)
Use the strict_auth_mechanism parameter to show only the specified authentication method. Other methods are hidden.
-
OAuth 2.0 resource only:
/login?strict_auth_mechanism=oauth2:rabbit_dev- Shows only the Click here to login button for the
rabbit_devresource server - No other authentication options are displayed
- Shows only the Click here to login button for the
-
Basic authentication only:
/login?strict_auth_mechanism=basic- Shows only the basic authentication form
- No OAuth 2.0 options are displayed
Troubleshooting
Troubleshooting management UI access in OAuth 2-enabled clusters is a companion guide dedicated to common OAuth 2-specific issues.
HTTP API
API Endpoints
See HTTP API reference.
HTTP API and Monitoring
The API is intended to be used for basic observability tasks. Prometheus and Grafana are recommended for long term metric storage, alerting, anomaly detection, and so on.
Any cluster node with rabbitmq-management plugin activated can be used for management UI access or
HTTP API access. It will reach out to other nodes and collect their stats, then aggregate and return
a response to the client.
When using the API in a cluster of nodes, there is no need to contact each node via HTTP API individually. Instead, contact a random node or a load balancer that sits in front of the cluster.
HTTP API Clients and Tooling
rabbitmqadmin v2 is a command-line tool that interacts with the HTTP API.
For HTTP API clients in several languages, see Developer Tools.
Maximum HTTP Request Body Limit
A few RabbitMQ HTTP API endpoints can potentially receive large payloads, most notably the endpoint used for definition import.
The default HTTP request body limit is 20 MiB. If such large definition files are not used in a cluster, the limit can be reduced:
# lowers the maximum HTTP request body size that will be accepted
# to 1 MiB
management.http.max_body_size = 1000000
When a client issues requests with a body that exceeds the limit, a 400 Bad Request response will be returned.
Using a Reverse Proxy in front of the HTTP API
It may be necessary to put a reverse proxy in front of a RabbitMQ cluster. Reverse proxy setup for RabbitMQ
may require careful handling of encoded slashes in paths if default virtual host (/) is used.
If default virtual host is not used, the additional settings to support encoded URIs will not be necessary. In other words, both Nginx and Apache configuration will require the standard minimum for any HTTP-based service.
Nginx
If RabbitMQ HTTP API access is configured for the root location (/),
the location must not have a slash at the end:
# trailing slash in the location must be omitted only if default RabbitMQ virtual host is used
location / {
    proxy_pass http://rabbitmq-host:15672;
}
If a different location will be used to proxy requests to the HTTP API, a URI rewrite rule must be used:
# these rewrites are only if default RabbitMQ virtual host is used
location ~* /rabbitmq/api/(.*?)/(.*) {
    proxy_pass http://rabbitmq-host:15672/api/$1/%2F/$2?$query_string;
}

location ~* /rabbitmq/(.*) {
    rewrite ^/rabbitmq/(.*)$ /$1 break;
    proxy_pass http://rabbitmq-host:15672;
}
Apache
To support encoded slashes in URIs, Apache requires users to explicitly enable
AllowEncodedSlashes.
# required only if default RabbitMQ virtual host is used
AllowEncodedSlashes On
for the Apache virtual host. Apache needs both mod_proxy and mod_proxy_http enabled. The location also needs a nocanon setting:
ProxyPassReverse / http://rabbitmq-host:15672/
# "nocanon" is required only if default RabbitMQ virtual host is used
ProxyPass / http://rabbitmq-host:15672/ nocanon
Configuration
There are several configuration options which affect the management plugin. These are managed through the main RabbitMQ configuration file.
It is possible to configure HTTP API and management UI to use a different port or network interface, enable HTTPS and so on.
While rarely needed, it is possible to configure multiple listeners (ports), for example to both enable HTTPS and retain support for clients that can only use HTTP (without TLS).
Port
The port is configured using the management.tcp.port key:
management.tcp.port = 15672
It is possible to configure what interface the API endpoint will use, similarly
to messaging protocol listeners, using
the management.tcp.ip key:
management.tcp.ip = 0.0.0.0
To check what interface and port is used by a running node, use
rabbitmq-diagnostics:
rabbitmq-diagnostics -s listeners
# => Interface: [::], port: 15672, protocol: http, purpose: HTTP API
# => Interface: [::], port: 15671, protocol: https, purpose: HTTP API over TLS (HTTPS)
or tools such as lsof, ss or netstat.
HTTPS
The management plugin can be configured to use HTTPS. See the guide on TLS to learn more about certificate authorities, certificates and private key files.
management.ssl.port       = 15671
management.ssl.cacertfile = /path/to/ca_certificate.pem
management.ssl.certfile   = /path/to/server_certificate.pem
management.ssl.keyfile    = /path/to/server_key.pem
## This key must only be used if private key is password protected
# management.ssl.password   = bunnies
More TLS options can be configured for the HTTPS listener.
management.ssl.port       = 15671
management.ssl.cacertfile = /path/to/ca_certificate.pem
management.ssl.certfile   = /path/to/server_certificate.pem
management.ssl.keyfile    = /path/to/server_key.pem
## This key must only be used if private key is password protected
# management.ssl.password   = bunnies

management.ssl.honor_cipher_order   = true
management.ssl.honor_ecc_order      = true
management.ssl.client_renegotiation = false
management.ssl.secure_renegotiate   = true

management.ssl.versions.1 = tlsv1.2
management.ssl.versions.2 = tlsv1.1

management.ssl.ciphers.1 = ECDHE-ECDSA-AES256-GCM-SHA384
management.ssl.ciphers.2 = ECDHE-RSA-AES256-GCM-SHA384
management.ssl.ciphers.3 = ECDHE-ECDSA-AES256-SHA384
management.ssl.ciphers.4 = ECDHE-RSA-AES256-SHA384
management.ssl.ciphers.5 = ECDH-ECDSA-AES256-GCM-SHA384
management.ssl.ciphers.6 = ECDH-RSA-AES256-GCM-SHA384
management.ssl.ciphers.7 = ECDH-ECDSA-AES256-SHA384
management.ssl.ciphers.8 = ECDH-RSA-AES256-SHA384
management.ssl.ciphers.9 = DHE-RSA-AES256-GCM-SHA384

## Usually RabbitMQ nodes do not perform peer verification of HTTP API clients
## but it can be enabled if needed. Clients then will have to be configured with
## a certificate and private key pair.
##
## See ./ssl#peer-verification for details.
# management.ssl.verify = verify_peer
# management.ssl.fail_if_no_peer_cert = true
Below is the same example in the classic config format.
The classic config format example is provided primarily for completeness sake,
using the modern rabbitmq.conf format for configuring this plugin is highly recommended.
%% The classic config format example is provided primarily for completeness sake,
%% using the modern `rabbitmq.conf` format for configuring this plugin is highly recommended.
[
  {rabbitmq_management,
   [
    {ssl_config, [{port,     15671},
                  {ssl,      true},
                  {cacertfile, "/path/to/ca_certificate.pem"},
                  {certfile,   "/path/to/server_certificate.pem"},
                  {keyfile,    "/path/to/server_key.pem"},

                  %% don't do peer verification to HTTPS clients
                  {verify,               verify_none},
                  {fail_if_no_peer_cert, false},

                  {client_renegotiation, false},
                  {secure_renegotiate,   true},
                  {honor_ecc_order,      true},
                  {honor_cipher_order,   true},

                  {versions,['tlsv1.2']},
                  {ciphers, ["ECDHE-ECDSA-AES256-GCM-SHA384",
                             "ECDHE-RSA-AES256-GCM-SHA384",
                             "ECDHE-ECDSA-AES256-SHA384",
                             "ECDHE-RSA-AES256-SHA384",
                             "ECDH-ECDSA-AES256-GCM-SHA384",
                             "ECDH-RSA-AES256-GCM-SHA384",
                             "ECDH-ECDSA-AES256-SHA384",
                             "ECDH-RSA-AES256-SHA384",
                             "DHE-RSA-AES256-GCM-SHA384"
                            ]}
                ]}
   ]}
 ].
Using HTTP and HTTPS Together
It is possible to use both HTTP and HTTPS on different ports:
management.tcp.port       = 15672

management.ssl.port       = 15671
management.ssl.cacertfile = /path/to/ca_certificate.pem
management.ssl.certfile   = /path/to/server_certificate.pem
management.ssl.keyfile    = /path/to/server_key.pem
The same configuration keys can be used to configure a single listener (just HTTP or HTTPS) and match those used by the Web STOMP and Web MQTT.
Advanced HTTP Options
Cowboy, the embedded Web server used by the management plugin, provides a number of options that can be used to customize the behavior of the server. Most of the options were introduced in RabbitMQ 3.7.9.
Response Compression
Response compression is enabled by default. To enable it explicitly, use management.tcp.compress:
management.tcp.compress = true
Client Inactivity Timeouts
Some HTTP API endpoints respond quickly, others may need to return or stream a sizeable data set to the client (for example many thousands of connections) or perform an operation that takes time proportionally to the input (for example import a large definitions file). In those cases the amount of time it takes to process the request can exceed certain timeouts in the Web server as well as HTTP client.
It is possible to bump Cowboy timeouts using the management.tcp.idle_timeout,
management.tcp.inactivity_timeout, management.tcp.request_timeout options.
management.tcp.inactivity_timeoutcontrols HTTP(S) client's TCP connection inactivity timeout. When it is reached, the connection will be closed by the HTTP server.management.tcp.request_timeoutcontrols the window of time in which the client has to send an HTTP request.management.tcp.idle_timeoutcontrols the window of time in which the client has to send more data (if any) within the context of an HTTP request.
If a load balancer or proxy is used between HTTP clients and the management HTTP server,
the inactivity_timeout and idle_timeout values should be at least as large, and often greater than,
the timeout and inactivity values used by the load balancer.
Here are some example configuration snippets that modify the timeouts:
# Configures HTTP (non-encrypted) listener timeouts
management.tcp.idle_timeout       = 120000
management.tcp.inactivity_timeout = 120000
management.tcp.request_timeout    = 10000
# Configures HTTPS (TLS-enabled) listener timeouts
management.ssl.idle_timeout       = 120000
management.ssl.inactivity_timeout = 120000
management.ssl.request_timeout    = 10000
All values are in milliseconds. Their defaults vary:
management.tcp.inactivity_timeouthas the default of 300 secondsmanagement.tcp.request_timeouthas the default of 60 secondsmanagement.tcp.idle_timeouthas the default of 5 seconds
It is recommended that if the inactivity or idle timeout need changing,
management.tcp.inactivity_timeout value should match or be greater than that
of management.tcp.idle_timeout.
management.tcp.request_timeout typically does not need increasing as clients send a request
shortly after establishing a TCP connection.
HTTP Request Logging
RabbitMQ nodes do not log any HTTP API requests by default.
To enable HTTP API access logging, use the management.http_log_dir key to
configure the path of a directory in which the access log log files can be created
by the node:
management.http_log_dir = /path/to/a/writeable/directory
For the change to have an effect, restart the plugin or the node.
Statistics Interval
By default the server will emit statistics events every
5 seconds (5000 ms). The message rate values shown in the management
plugin are calculated over this period.
Increasing this value will reduce CPU resource consumption of stats collection in environments with a large number of stats emitting entities such as connections, channels, queues.
In order to do so, set the value of the collect_statistics_interval configuration key
to the desired interval in milliseconds and restart the node:
# 15s
collect_statistics_interval = 15000
Message Rates
The management plugin by default shows message rates globally, and for each queue, channel, exchange, and vhost. These are known as the basic message rates.
It can also show message rates for all the combinations of channel to exchange, exchange to queue, and queue to channel. These are known as detailed message rates. Detailed message rates are disabled by default as they can have a large memory footprint when there are a large number of combinations of channels, queues and exchanges.
Alternatively, the message rates can be disabled altogether. This can help get reduce CPU resource consumption of the plugin.
The message rate mode is controlled by the
management.rates_mode configuration key:
# supported values: basic, detailed, none
management.rates_mode = basic
Supported values are basic (the default), detailed, and none.
Sample (Data Point) Retention
The management plugin will retain samples of some data such as message rates and queue lengths. Depending on how long the data is retained, some time range options on UI charts may be incomplete or unavailable.
There are three policies:
global: how long to retain data for the overview and virtual host pagesbasic: how long to retain data for individual connections, channels, exchanges and queuesdetailed: how long to retain data for message rates between pairs of connections, channels, exchanges and queues (as shown under "Message rates breakdown")
Below is a configuration example:
management.sample_retention_policies.global.minute  = 5
management.sample_retention_policies.global.hour    = 60
management.sample_retention_policies.global.day = 1200

management.sample_retention_policies.basic.minute = 5
management.sample_retention_policies.basic.hour   = 60

management.sample_retention_policies.detailed.10 = 5
The configuration in the example above retains global data at a 5 second resolution (sampling happens every 5 seconds) for a minute, then at a 1 minute (60 second) resolution for 1 hour, then at a 20 minute resolution for one day. It retains basic data at a 5 second resolution for 1 minute, at a 1 minute (60 second) resolution for 1 hour, and detailed data only for 10 seconds.
All three policies are mandatory, and must contain at least one retention setting (period).
Disable Statistics and Metric Collection
It is possible to disable the statistics in the UI and HTTP API in order for these to be used only for operations. This can be a useful feature if external monitoring solutions such as Prometheus and Grafana are being used. If statistics are disabled in any of the following ways, all charts and detailed statistics will be hidden in the UI.
In order to completely disable the internal metrics collection, the disable_metrics_collector flag must be set in the rabbitmq_management_agent plugin.
The Prometheus plugin will still work even if collection is disabled.
management_agent.disable_metrics_collector = true
Disabling the metrics collection is the preferred option if it is being used with an external monitoring system, as this reduced the overhead that statistics collection and aggregation causes in the broker. If the statistics are only temporary disabled, or are not required in some HTTP API queries, the aggregation of the stats can be disabled in the rabbitmq_management plugin. The disable flag can be also passed as part of the query string in the URI.
As at the moment the Prometheus plugin cannot report individual queue totals, there is a configuration option that allows to list messages, messages_ready and messages_unacknowledged in the queues endpoint.
Below is a configuration example that disables the statistics but returns individual queue totals in the queues page:
management.disable_stats = true
management.enable_queue_totals = true
Content Security Policy (CSP)
It is possible to configure what CSP header value
is used by HTTP API responses. The default value is script-src 'self' 'unsafe-eval' 'unsafe-inline'; object-src 'self':
management.csp.policy = script-src 'self' 'unsafe-eval' 'unsafe-inline'; object-src 'self'
The value can be any valid CSP header string:
management.csp.policy = default-src https://rabbitmq.eng.example.local
Wildcards are also allowed:
management.csp.policy = default-src 'self' *.eng.example.local
A CSP policy frame-ancestors directive can be used
to prevent frame embedding of the management UI, mitigating
certain types of cross-frame scripting attacks:
# prohibits iframe embedding of the UI
management.csp.policy = frame-ancestors 'none'
Strict Transport Security (HSTS)
It is possible to configure what Strict Transport Security header value is used by HTTP API responses:
management.hsts.policy = max-age=31536000; includeSubDomains
Cross-origin Resource Sharing (CORS)
The management UI application will by default refuse access to websites hosted on origins different from its own using the Cross-Origin Resource Sharing mechanism, also known as CORS. It is possible to white list origins:
management.cors.allow_origins.1 = https://origin1.org
management.cors.allow_origins.2 = https://origin2.org
It is possible to allow any origin to use the API using a wildcard. This is highly discouraged for deployments where the UI application may be exposed to the public.
management.cors.allow_origins.1 = *
The CORS pre-flight requests are cached by the browser. The management plugin defines a timeout of 30 minutes by default. The value can be changed. It is configured in seconds:
management.cors.allow_origins.1 = https://origin1.org
management.cors.allow_origins.2 = https://origin2.org
management.cors.max_age         = 3600
Other Security-related Headers
It is possible to set a few more security-related headers for management UI and HTTP API responses. Note that some of them have been superseded by CORS and other newer development in the browser security space.
The supported headers are:
management.headers.content_type_options = nosniff
management.headers.xss_protection = 1; mode=block
management.headers.frame_options = DENY
They can be combined with the aforementioned CORS, HSTS, CSP headers:
management.hsts.policy = max-age=31536000; includeSubDomains
management.csp.policy = default-src 'self'; script-src 'self' 'unsafe-eval'

management.headers.content_type_options = nosniff
management.headers.xss_protection = 1; mode=block
management.headers.frame_options = DENY
Login Session Timeout
After the user logs in, the user's web UI login session will expire after 8 hours by default.
It is possible to configure a different timeout using the
login_session_timeout setting.
The value should be an integer: it controls the length of login session in minutes. When the time is up, the user will be signed out.
The following example sets the session timeout to 1 hour:
management.login_session_timeout = 60
Path Prefix
Some environments require the use of a custom prefix for
all HTTP requests to the management plugin. The
management.path_prefix setting allows an arbitrary
prefix to be set for all HTTP request handlers in the
management plugin.
Setting management.path_prefix to /my-prefix
specifies all API requests to use the URI
host:port/my-prefix/api/[...]
The management UI login page will have the URI
host:port/my-prefix/ - note that the
trailing slash is required in this case.
management.path_prefix = /my-prefix
Example
An example configuration file for RabbitMQ that switches on request logging, increases the statistics interval to 10 seconds and explicitly sets some other relevant parameters to their default values, would look like this:
listeners.tcp.default = 5672

collect_statistics_interval = 10000

## Note: this uses the core `load_definitions` key over
## now deprecated `management.load_definitions`
# load_definitions = /path/to/exported/definitions.json

management.tcp.port = 15672
management.tcp.ip   = 0.0.0.0

management.ssl.port       = 15671
management.ssl.ip         = 0.0.0.0
management.ssl.cacertfile = /path/to/ca_certificate.pem
management.ssl.certfile   = /path/to/server_certificate.pem
management.ssl.keyfile    = /path/to/server_key.pem

management.http_log_dir = /path/to/rabbit/logs/http

management.rates_mode = basic

# Configure how long aggregated data (such as message rates and queue
# lengths) is retained.
# Your can use 'minute', 'hour' and 'day' keys or integer key (in seconds)
management.sample_retention_policies.global.minute    = 5
management.sample_retention_policies.global.hour  = 60
management.sample_retention_policies.global.day = 1200

management.sample_retention_policies.basic.minute   = 5
management.sample_retention_policies.basic.hour = 60

management.sample_retention_policies.detailed.10 = 5
Loading Definitions (Schema) at Startup
Nodes and clusters store information that can be thought of as schema, metadata or topology. Users, vhosts, queues, exchanges, bindings, runtime parameters all fall into this category.
Definitions can be exported and imported via rabbitmqctl, rabbitmqadmin or the HTTP API
provided by this plugin.
Please refer to the Definitions guide.
Metrics Collection and HTTP API in Clusters
Client Requests
The management plugin is aware of clusters. It can be enabled on one or more nodes in a cluster, and see information pertaining to the entire cluster no matter which node you connect to.
Running Management Plugin on a Subset of Nodes
It is possible to deploy management plugin only on a subset of cluster nodes.
In that case only the nodes running the plugin would be able to serve client HTTP API requests.
For every cluster node to have its metrics collected, it is still required that the
rabbitmq-management-agent plugin is enabled on each node, otherwise
the metrics from the node won't be available.
Aggregation Queries in Clusters
In cluster, HTTP API performs cluster-wide queries when handling client requests, which means it can be affected by network partitions, network slowdowns, and unresponsive nodes.
Timeouts for inter-node aggregation queries are controlled via the net tick mechanism. Lowering the value may help reduce the delay introduced by nodes that have recently become unresponsive. Values lower than 10s can produce false positives and must be avoided.
In contrast to the HTTP API, the Prometheus monitoring endpoint only serves node-local data and is generally not affected by failures or unavailability of other nodes in the cluster.
(Reverse HTTP) Proxy Setup
It is possible to make the web UI available via any proxy that conforms with RFC 1738. The following sample Apache configuration illustrates the minimum necessary directives to coax Apache into conformance. It assumes a management web UI on the default port of 15672:
AllowEncodedSlashes      NoDecode
ProxyPass         "/api" http://localhost:15672/api nocanon
ProxyPass         "/"    http://localhost:15672/
ProxyPassReverse  "/"    http://localhost:15672/
Restarting Statistics Database
Statistics database is stored entirely in memory. All of its contents is transient and should be treated as such.
In modern versions, ach node has its own statistics database containing a fraction of stats recorded on this node.
It is possible to restart the stats database on a given node using
rabbitmqctl or an HTTP API endpoint:
DELETE /api/reset/:node
rabbitmqctl eval 'rabbit_mgmt_storage:reset().'
To reset the entire statistics database on all nodes, use
DELETE /api/reset
rabbitmqctl eval 'rabbit_mgmt_storage:reset_all().'
Memory Usage Analysis and Memory Management
Management UI can be used to inspect node's memory use, including displaying a per-category breakdown. See the Memory Use Analysis guide for details.
Management database builds around periodically emitted stats, regulated by the statistics interval described above, or when certain components are created/declared (for example a new connection or channel is opened, or a queue declared) or closed/deleted. Message rates do not directly affect management database memory usage.
Total amount of memory consumed by the stats database depends on the topology size (for example the number of queues), number of concurrent connections and channels, event emission interval, effective rates mode and retention policies.
Entities that emit stats (connections, channels, queues, nodes) do so periodically.
The interval can be configured using the collect_statistics_interval key:
# sets the interval to 30 seconds
collect_statistics_interval = 30000
Increasing the interval value to 30-60s will reduce CPU footprint and peak memory consumption for systems with large amounts of connections, channels and queues. This comes with a downside: metrics of said entities will refresh every 30-60 seconds. This can be perfectly reasonable in an externally monitored production system but will make management UI less convenient to use for operators.
The memory usage of the channel and stats collector processes can be limited
by setting the maximum backlog queue size using the parameter
stats_event_max_backlog. If the backlog queue is full, new channel
and queue stats will be dropped until the previous ones have been processed.
The statistics interval can also be changed at runtime. Doing so will have no effect on existing connections, channels or queues. Only new stats emitting entities are affected.
rabbitmqctl eval 'application:set_env(rabbit, collect_statistics_interval, 60000).'
The statistics database can be restarted (see above) and thus forced to release all memory. Management UI's Overview page contains buttons that reset stats database for individual nodes as well as all nodes in the cluster.
Publishing and Consuming over HTTP API
It is possible to publish and consume messages using the HTTP API. This way of messaging is discouraged: prefer one of the binary messaging protocols supported by RabbitMQ. Publishing and consuming that way will be significantly more efficient and will provide access to various messaging protocol features such as confirmations.
Publishing over HTTP API can be useful in environments where long lived messaging protocol connections is not an option.