RabbitMQ Performance Measurements, part 2
Welcome back! Last time we talked about flow control and latency; today let's talk about how different features affect the performance we see. Here are some simple scenarios. As before, they're all variations on the theme of one publisher and one consumer publishing as fast as they can.
Some Simple Scenarios
This first scenario is the simplest - just one producer and one consumer. So we have a baseline.
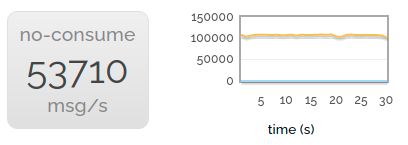
Of course we want to produce impressive figures. So we can go a bit faster than that - if we don't consume anything then we can publish faster.
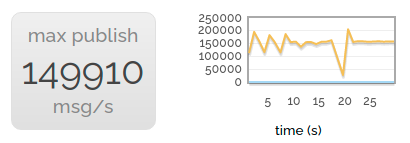
This uses a couple of the cores on our server - but not all of them. So for the best headline-grabbing rate, we start a number of parallel producers, all publishing into nothing.
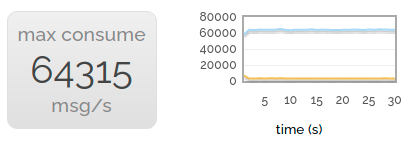
Of course, consuming is rather important! So for the headline consuming rate, we publish to a large number of consumers in parallel.
Of course to some extent this quest for large numbers is a bit silly, we're more interested in relative performance. So let's revert to one producer and one consumer.
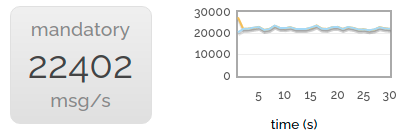
Now let's try publishing with the mandatory flag set. We drop to about 40% of the non-mandatory rate. The reason for this is that the channel we're publishing to can't just asynchronously stream messages at queues any more; it synchronously checks with the queues to make sure they're still there. (Yes, we could probably make mandatory publishing faster, but it's not very heavily used.)
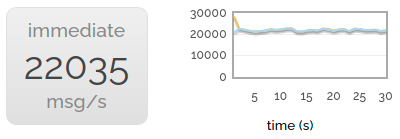
The immediate flag gives us almost exactly the same drop in performance. This isn't hugely surprising - it has to make the same synchronous check with the queue.
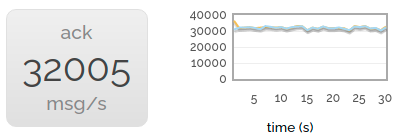
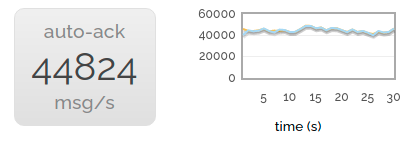
Scrapping the rarely-used mandatory and immediate flags, let's try turning on acknowledgements for delivered messages. We still see a performance drop compared to delivering without acknowledgements (the server has to do more bookkeeping after all) but it's less noticeable.
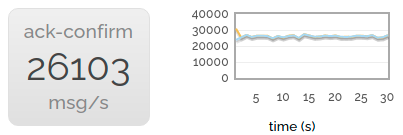
Now we turn on publish confirms as well. Performance drops a little more but we're still at over 60% the speed of neither acks nor confirms.
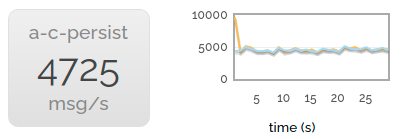
Finally, we enable message persistence. The rate becomes much lower, since we're throwing all those messages at the disk as well.
Message Sizes
Notably, all the messages we've been sending until now have only been a few bytes long. There are a couple of reasons for this:
- Quite a lot of the work done by RabbitMQ is per-message, not per-byte-of-message.
- It's always nice to look at big numbers.
But in the real world we will often want to send bigger messages. So let's look at the next chart:
1 -> 1 sending rate message sizes
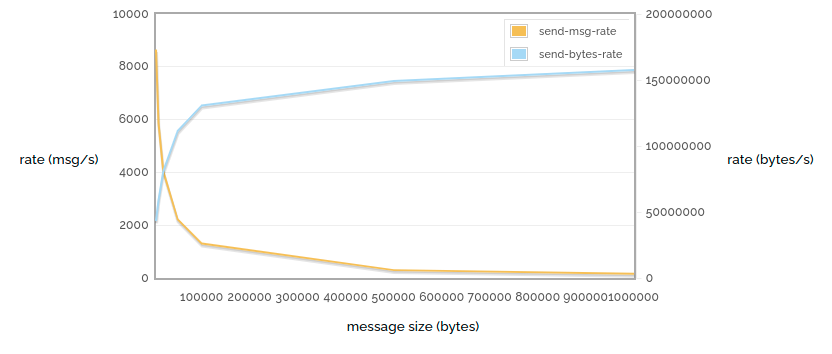
Here (again) we're sending unacked / unconfirmed messages as fast as possible, but this time we vary the message size. We can see that (of course) the message rate drops further as the size increases, but the actual number of bytes sent increases as we have less and less routing overhead.
So how does the message size affect horizontal scaling? Let's vary the number of producers with different message sizes. Just for a change, in this test we're not going to have any consumers ar all.
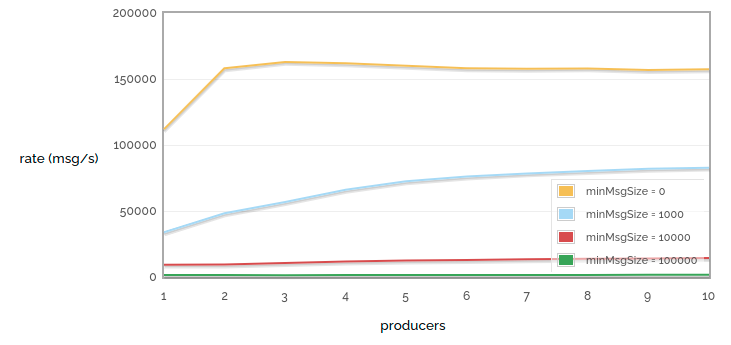
n -> 0 sending msg rate vs number of producers, for various message sizes
n -> 0 sending bytes rate vs number of producers, for various message sizes
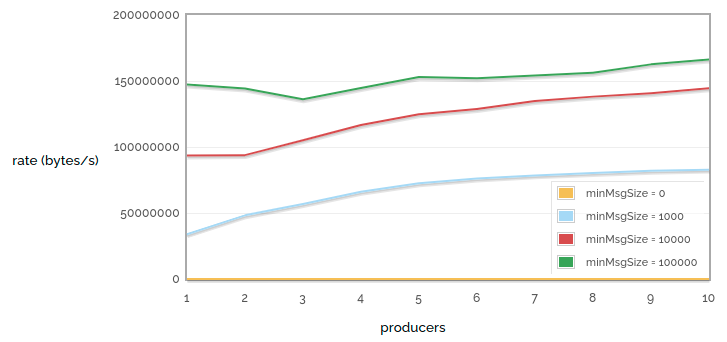
In these tests we can see that for small messages it only takes a couple of producers to reach an upper bound on how many messages we can publish, but that for larger messages we need more producers to use the available bandwidth.
Another frequently confusing issue is performance around consumers with a prefetch count. RabbitMQ (well, AMQP) defaults to sending all the messages it can to any consumer that looks ready to accept them. The maximum number of these unacknowledged messages per channel can be limited by setting the prefetch count. However, small prefetch counts can hurt performance (since we can be waiting for acks to arrive before sending out more messages).
So let's have a look at prefetch count and, while we're there, also consider the number of consumers consuming from a single queue. This chart contains some deliberately absurd extremes.
1 -> n receiving rate vs consumer count / prefetch count
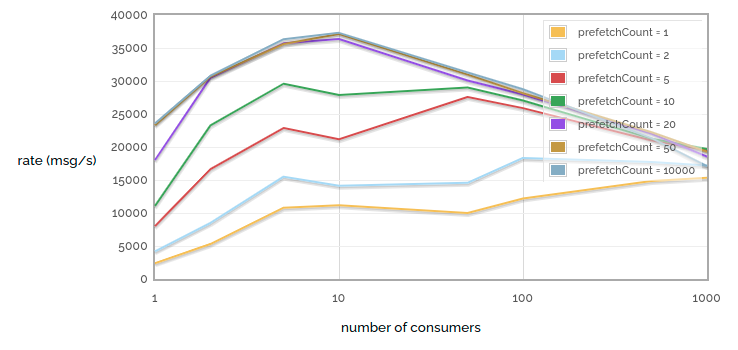
The first thing to notice is that tiny prefetch counts really hurt performance. Note the large difference in performance between prefetch = 1 and prefetch = 2! But we also get into diminishing returns - notice that the difference between prefetch = 20 and prefetch = 50 is hard to see, and the difference between prefetch = 50 and prefetch = 10000 is almost invisible. Of course, this is because for our particular network link prefetch = 50 already ensures that we never starve the consumer while waiting for acks. Of course, this test was run over a low latency link - more latent links will benefit from a higher prefetch count.
The second thing to notice is that when we have a small number of consumers, adding one more will increase performance (we get more parallellism). And with a tiny prefetch count, increasing consumers even up to a large number has benefits (since each individual consumer spends much of its time starved). But when we have a larger prefetch count, increasing the number of consumers is not so helpful, since even a small number can kept busy enough to max out our queue, but the more consumers we have the more work RabbitMQ has to do to keep track of all of them.
Large queues
All the examples we've looked at so far have one thing in common: very few messages actually get queued. In general we've looked at scenarios where messages get consumed as quickly as they get produced, and thus each queue has an average length of 0.
So what happens whe queues get big? When queues are small(ish) they will reside entirely within memory. Persistent messages will also get written to disc, but they will only get read again if the broker restarts.
But when queues get larger, they will get paged to disc, persistent or not. In this case performance can take a hit as suddenly we need to access the disc to send messages to consumers. So let's run a test: publish a lot of non-persistent messages to a queue, and then consume them all.
Queue load / drain 500k messages
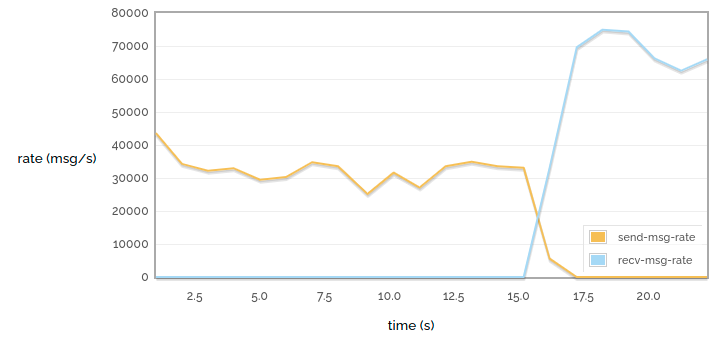
In this small case we can see fairly consistent performance: the messages go into the queue fairly quickly and then come out even more quickly.
Queue load / drain 10M messages
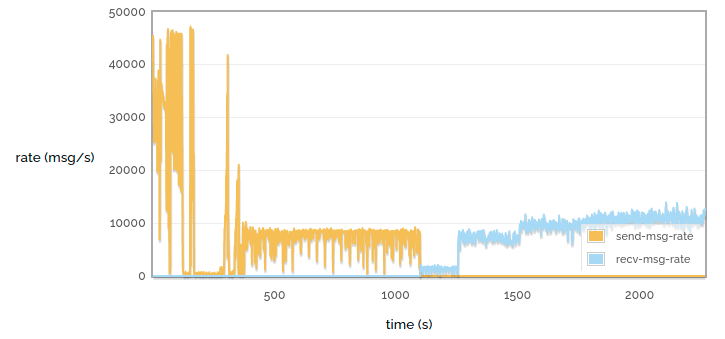
But when we have a larger queue we see that the performance varies a lot more. We see that when loading the queue we initially get a very high throughput, then a pause while some of the queue is paged out to disc, then a more consistent lower throughput. Similarly when draining the queue we see a much lower rate when pulling the messages from disc.
Performance of disc-bound queues is a complex topic - see Matthew's blog post on the subject for some more talk on the subject.