Cluster Sizing Case Study – Quorum Queues Part 2
In the last post we started a sizing analysis of our workload using quorum queues. We focused on the happy scenario that consumers are keeping up meaning that there are no queue backlogs and all brokers in the cluster are operating normally. By running a series of benchmarks modelling our workload at different intensities we identified the top 5 cluster size and storage volume combinations in terms of cost per 1000 msg/s per month.
- Cluster: 7 nodes, 8 vCPUs (c5.2xlarge), gp2 SDD. Cost: $54
- Cluster: 9 nodes, 8 vCPUs (c5.2xlarge), gp2 SDD. Cost: $69
- Cluster: 5 nodes, 8 vCPUs (c5.2xlarge), st1 HDD. Cost: $93
- Cluster: 5 nodes, 16 vCPUs (c5.4xlarge), gp2 SDD. Cost: $98
- Cluster: 7 nodes, 16 vCPUs (c5.4xlarge), gp2 SDD. Cost: $107
There are more tests to run to ensure these clusters can handle things like brokers failing and large backlogs accumulating during things like outages or system slowdowns.
All quorum queues are declared with the following properties:
- x-quorum-initial-group-size=3
- x-max-in-memory-length=0
The x-max-in-memory-length property forces the quorum queue to remove message bodies from memory as soon as it is safe to do. You can set it to a longer limit, this is the most aggressive - designed to avoid large memory growth at the cost of more disk reads when consumers do not keep up. Without this property message bodies are kept in memory at all times which can place memory growth to the point of memory alarms setting off which severely impacts the publish rate - something we want to avoid in this workload case study.
Adverse Conditions - Coping with rolling restarts and lost brokers
We are using quorum queues because we care about our data and availability. If we lose a broker due to a disk failure, or because we had to reboot as part of an emergency OS patch, then we get continued availability and no data loss, but can we maintain our target peak rate of 30k msg/s? Resiliency isn't just about not losing data and remaining available, it's about handling the load adequately as well.
To that end, we run exactly the same test again, but hard kill a broker part way into each intensity level.
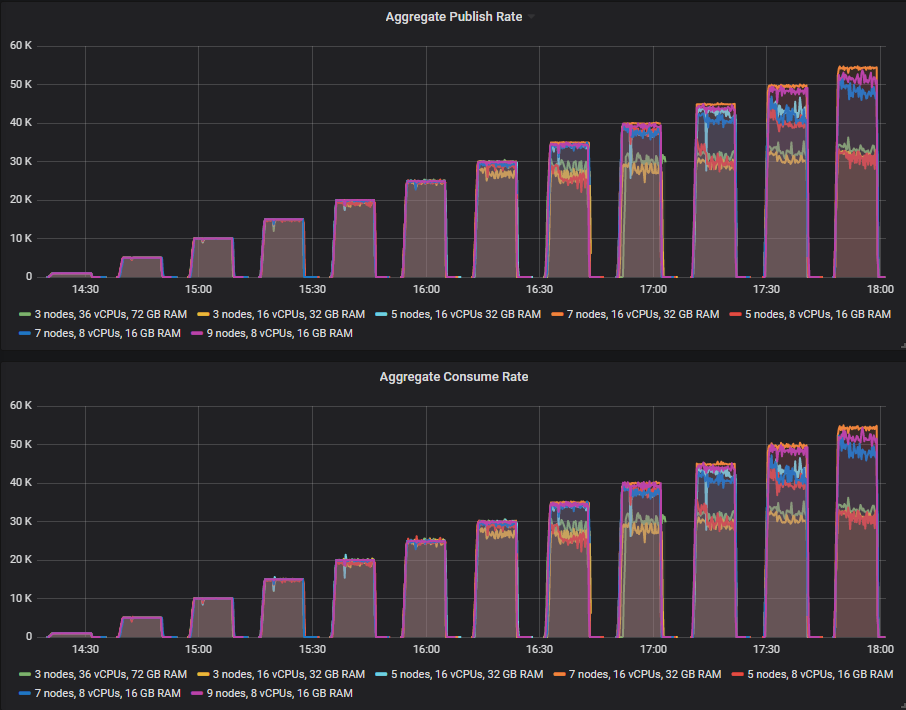
In the same test with mirrored queues (with one master, one mirror) we saw a drop-off in throughput when a broker was killed off. With quorum queues we don’t see such a strong effect.
Let’s look at our 30k msg/s target rate period.
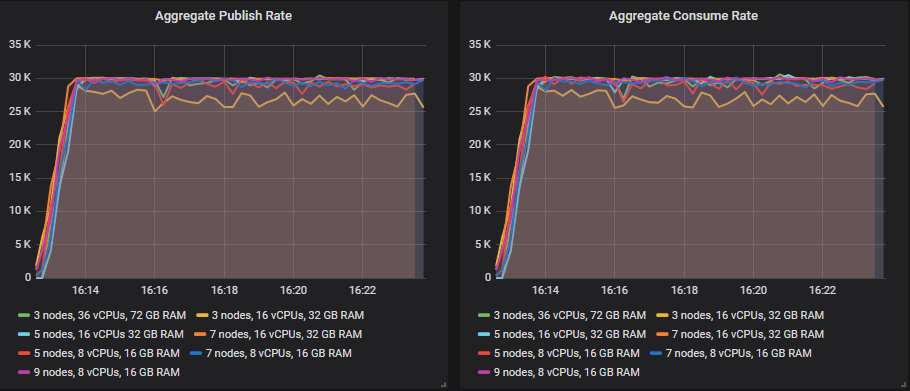
The reason why we saw the large impact of losing a broker with mirrored queues is that mirrored queues try to maintain the redundancy level by creating a new mirror on another broker when a master or mirror is lost. This concentrates the same amount of message traffic on fewer servers. Quorum queues do not do this. If a broker is lost that hosts a queue replica, then the membership of that queue does not change. As long as the majority of queue replicas (leader, followers) are available the queue continues to function. As soon as the broker comes back online, its follower replica on that broker will start getting replicated to again.
So replication traffic does not get concentrated on fewer servers, only the client traffic does. Quorum queues also benefit from the fact that if a consumer happens to connect to a broker that hosts a follower replica of the queue they want to consume, then they read directly from that replica - no proxying of messages from the broker that hosts the leader to the broker that the consumer is connected to.
The fact that mirrored queues try to maintain the redundancy level by creating new mirrors is undermined by the fact that synchronisation is blocking. So many admins use manual synchronisation to avoid a huge traffic spike between the remaining brokers as new mirrors get replicated to.
The largest clusters (7x16, 7x8 and 9x8) saw no noticeable impact of losing the broker. The fail-overs to new leaders was fast and throughput carried on as before.
Adverse Conditions - Consumer Slowdown
When processing messages, consumers normally need to interact with other systems like databases or third party APIs. These downstream systems can slowdown due heavy load, or some kind of outage and this has the knock-on effect of slowing down your consumers. This then causes the number of messages in your queues to grow which can then also impact publishers. RabbitMQ delivers best performance when queues are small or empty (empty because messages are immediately consumed).
Our requirements dictated that if we suffer a consumer slowdown, the publishing should continue unaffected, even at the target peak load of 30k msg/s.
In this test the processing time per message varies:
- 5 minutes at 10ms
- Grows from 10ms to 30ms over a 20 minute period
- 5 minutes at 30ms
- Reduces from 30ms to 10ms over a 20 minute period
- 50 minutes at 10ms
The message backlogs can grow into the tens of millions as this is a high traffic system where backlogs can form fast. We shall see an S shape to the consume rate as first the processing time increases, then decreases and consume rate then exceeds the publish rate as the consumers process the backlog.
As the consume rate recovers but the queue length is still very large, this is when we might see impact on the publishers. The publish rate can drop for a period until the backlog is cleared. The higher performing clusters should see no impact or an impact for a short duration.
We'll run the test at three different publish rates:
- 10k msg/s with 200 consumers across the 100 queues. Top consume rate is 20k msg/s which then drops to 6.6k msg/s at the 30ms processing time.
- 20k msg/s with 300 consumers across the 100 queues. Top consume rate is 30k msg/s which then drops to 10k msg/s at the 30ms processing time.
- 30k msg/s with 400 consumers across the 100 queues. Top consume rate is 40k msg/s which then drops to 13.3k msg/s at the 30ms processing time.
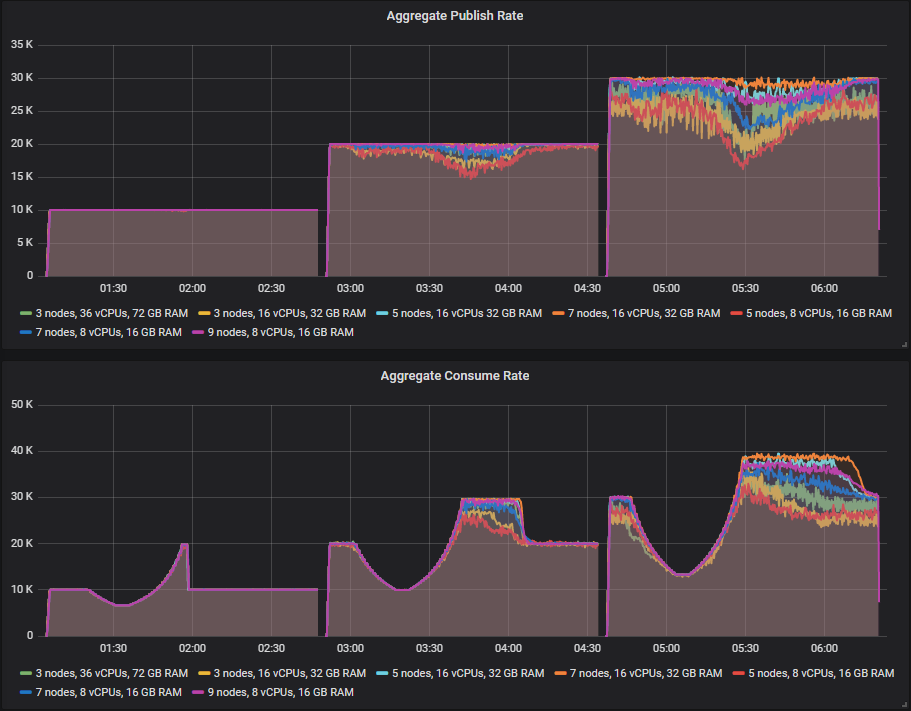
The first thing to notice is how much better quorum queues fared than mirrored queues. With mirrored queues, no clusters managed to maintain the 30k msg/s publish rate in this test, but with quorum queues the 7x16 cluster just managed to handle it.
See some examples of how large the queue backlogs became.
3x16 Cluster

7x16 Cluster

9x8 Cluster

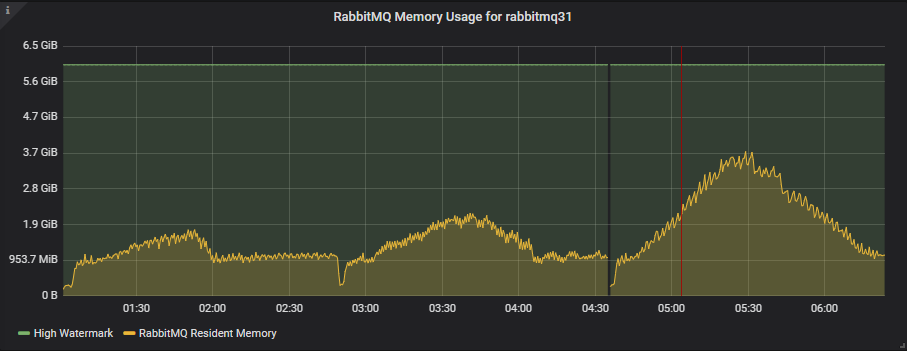
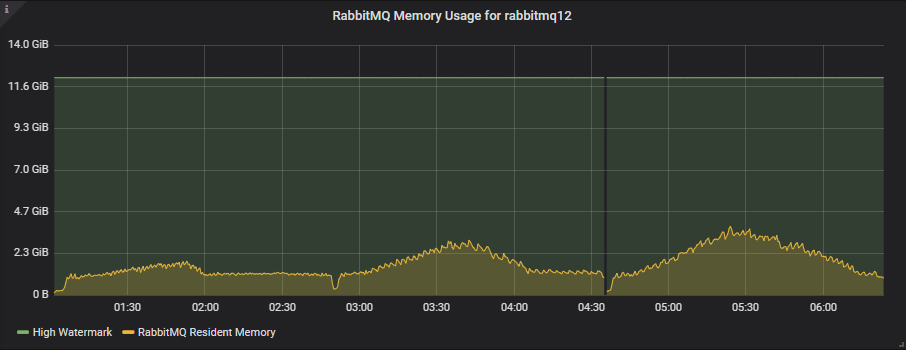
Despite the queue backlogs across the 100 queues reaching as high as 25 million, memory usage stays well below the high watermark (which is when memory alarms would block the publishers).
All clusters handled this test at 10k msg/s. At 20k msg/s only two clusters handled it (7x16 and 9x8). The 7x16 cluster is the clear winner in this test as it managed to handle the very stressful 30k msg/s test which created backlogs of up to 25 million messages.
You can run a test like with PerfTest (from version 2.12 and up):
bin/runjava com.rabbitmq.perf.PerfTest \
-H amqp://guest:guest@10.0.0.1:5672/%2f,amqp://guest:guest@10.0.0.2:5672/%2f,amqp://guest:guest@10.0.0.3:5672/%2f \
-z 1800 \
-f persistent \
-q 1000 \
-c 1000 \
-ct -1 \
-ad false \
--rate 100 \
--size 1024 \
--queue-pattern 'perf-test-%d' \
--queue-pattern-from 1 \
--queue-pattern-to 100 \
-qa auto-delete=false,durable=false,x-queue-type=quorum \
--producers 200 \
--consumers 200 \
--producer-random-start-delay 30 \
-vl 10000:300 \
-vl 11000:60 -vl 12000:60 -vl 13000:60 -vl 14000:60 -vl 15000:60 -vl 16000:60 -vl 17000:60 -vl 18000:60 -vl 19000:60 \
-vl 20000:60 -vl 21000:60 -vl 22000:60 -vl 23000:60 -vl 24000:60 -vl 25000:60 -vl 26000:60 -vl 27000:60 -vl 28000:60 -vl 29000:60 \
-vl 30000:300 \
-vl 29000:60 -vl 28000:60 -vl 27000:60 -vl 26000:60 -vl 25000:60 -vl 24000:60 -vl 23000:60 -vl 22000:60 -vl 21000:60 -vl 20000:60 \
-vl 19000:60 -vl 18000:60 -vl 17000:60 -vl 16000:60 -vl 15000:60 -vl 14000:60 -vl 13000:60 -vl 12000:60 -vl 11000:60 -vl 10000:60 \
-vl 10000:3000
Adverse Conditions - Publish Rate Peak Exceeds Consumer Capacity
Like the consumer slowdown, we end up with a situation where the publish rate exceeds the consume rate causing message backlogs. But this time caused by a large peak in the publish rate, one that our backend systems are unable to handle. Absorbing peaks in the publish rate is one of the reasons to choose a message queue. You don't need to scale-out your backend systems to handle peak load, which might be expensive, instead you allow the message queue to absorb the extra traffic instead. Then you process the backlog over a time period.
In this test we keep the processing time at 10ms but increase the publish rate then decrease it:
- 5 minutes at base rate
- Grows from base rate to peak over a 20 minute period
- 5 minutes at peak.
- Reduces from peak to base rate over a 20 minute period
- 50 minutes at base
We'll run three tests:
- 10 k msg/s base publish rate, 20k msg/s peak. 200 consumers with 13k msg/s top consume rate.
- 20 k msg/s base publish rate, 30k msg/s peak. 300 consumers with 23k msg/s top consume rate.
- 30 k msg/s base publish rate, 40k msg/s peak. 400 consumers with 33k msg/s top consume rate.
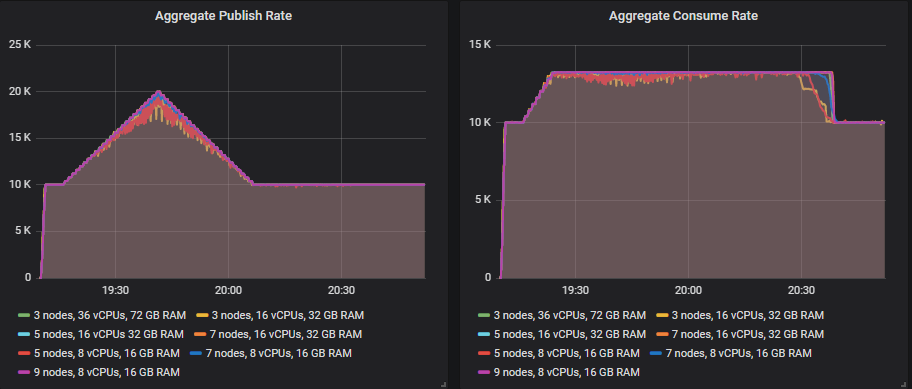
All the clusters managed to reach the 20k msg/s publish rate peak except for the 3x16 and 5x8 clusters.
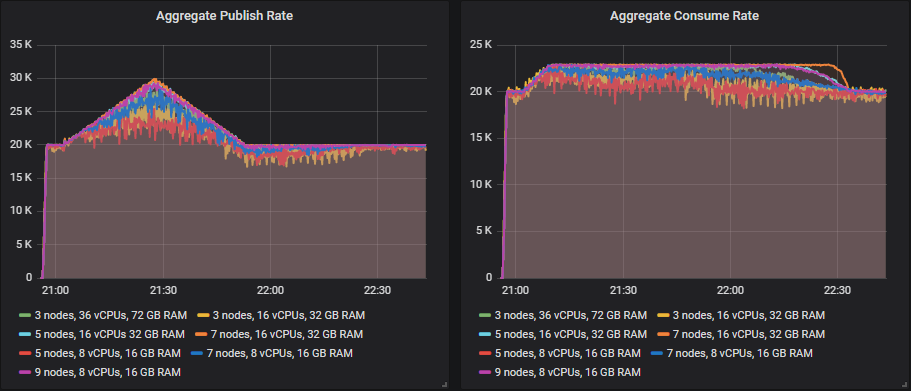
Only the larger 5x16, 7x18 and 9x8 clusters manage to hit the 30k msg/s peak.
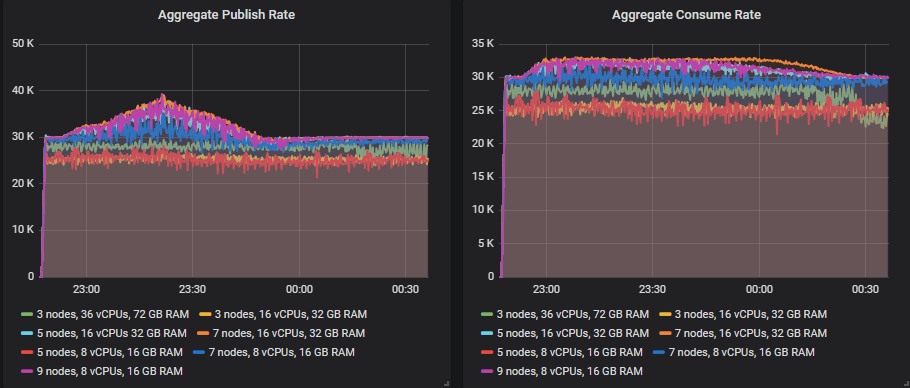
The 7x16 cluster barely managed to hit the 40k msg/s peak and saw its message backlog reach close to 6 million messages but it still handled it.

You can run a test like with PerfTest:
bin/runjava com.rabbitmq.perf.PerfTest \
-H amqp://guest:guest@10.0.0.1:5672/%2f,amqp://guest:guest@10.0.0.2:5672/%2f,amqp://guest:guest@10.0.0.3:5672/%2f \
-z 1800 \
-f persistent \
-q 1000 \
-ct -1 \
-ad false \
-c 1000 \
--size 1024 \
--queue-pattern 'perf-test-%d' \
--queue-pattern-from 1 \
--queue-pattern-to 100 \
-qa auto-delete=false,durable=false,x-queue-type=quorum \
--producers 200 \
--consumers 200 \
--producer-random-start-delay 30 \
--consumer-latency 10000 \
-vr 100:300 \
-vr 102:60 -vr 104:60 -vr 106:60 -vr 108:60 -vr 110:60 -vr 112:60 -vr 114:60 -vr 116:60 -vr 118:60 -vr 120:60 \
-vr 122:60 -vr 124:60 -vr 126:60 -vr 128:60 -vr 130:60 -vr 132:60 -vr 134:60 -vr 136:60 -vr 138:60 -vr 140:60 \
-vr 142:60 -vr 144:60 -vr 146:60 -vr 148:60 -vr 150:60 \
-vr 148:60 -vr 146:60 -vr 144:60 -vr 142:60 -vr 140:60 -vr 138:60 -vr 136:60 -vr 134:60 -vr 132:60 -vr 130:60 \
-vr 128:60 -vr 126:60 -vr 124:60 -vr 122:60 -vr 120:60 -vr 118:60 -vr 116:60 -vr 114:60 -vr 112:60 -vr 110:60 \
-vr 108:60 -vr 106:60 -vr 104:60 -vr 102:60 -vr 100:60 \
-vr 100:3000
Adverse Conditions Tests - Conclusions
After performing the ideal conditions tests, we had many clusters that could handle the peak load so we ended up a top 5 leaderboard of clusters in terms of cost per 1000 msgs/s per month. Now after running the adverse conditions tests we're down to two potentials from the original set. The 7x16 was the only cluster to handle all tests but if you are also sensitive to cost then the cheaper 9x8 was close to passing the backlog tests.
- Cluster: 7 nodes, 16 vCPUs, gp2 SSD. Cost: $104 per 1000 msg/s
- Cluster: 9 nodes, 8 vCPUs, gp2 SDD. Cost: $81 per 1000 msg/s
Scaling out the smaller VMs gave us the best top throughput and cost effectiveness in the ideal conditions. But the 7x16 was the best all-rounder when taking into account the adverse conditions.
For this workload I would choose quorum queues (with gp2 volumes) over mirrored queues based on their superior ability to continue to handle the ingress rate in the event of message backlogs. Of course there are other reasons to choose quorum queues on top of that:
- better data safety
- higher availability when handling rolling restarts
Quorum Queue Case Study Takeaways
The takeaways are the same as the mirrored queue case study: don't just run tests under ideal conditions. Make sure you include adverse conditions tests into your methodology or you may find that your cluster cannot handle your workload when you need it most. Systems are more likely to suffer these kinds of issues when under heavy load, so test at your expected peak load levels and beyond.
The bottom line is that RabbitMQ can handle broker loss pretty well, what it struggles with more are queue backlogs. Our top clusters, the 7x16 and 9x8 configurations hit 65-70k msg/s in ideal conditions but only 20-30k msg/s in the most adverse conditions we threw at it. I say only 20-30k msg/s, but that is 1.7-2.5 billion daily messages which is higher than most use cases for RabbitMQ.
Finally...this was a specific workload, check out the other recommendations in the first post that can apply to other workloads and scenarios.